
I was recently trying to debug some Javascript code in a webpage that was having problems on certain combinations of OS/browsers and I needed to quickly find out why. The difficult bit was that it was my test users who were having trouble, not me, so I couldn’t just jump on their machine and debug the issue. Firstly I started peppering the code with console.log() (the classic printf debugging technique) output and then getting the users to email me the output from the browser’s Javascript console. This worked.. to an extent. It relies on your user’s ability to activate the console and reliably copy+paste the output into an email. Some users are fine with this, but with others you might as well be asking them to perform a heart transplant. And then there’s another class of users: the ones on iOS or Android who don’t even have a console(!)
I hit upon a really simple solution: output a debug log to the webpage html. It’s then just a case of asking the user to cut+paste or screendump the log and email it to me. This is incredibly simple to do and the solution comes in two parts: the Javascript code and the HTML.
The Javascript code
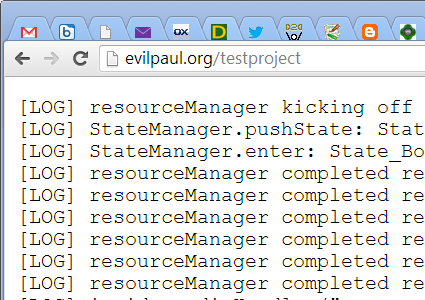
The method is straightforward: take an empty list, append to that list every time LOGMSG() is called and also copy the message text to the webpage. The list is limited to 20 lines but you can easily change that. The code also copies the message text to the Javascript console for good measure.
var logLines=[] function LOGMSG(msg) { var fullMsg = "[LOG] " + msg; if (document.getElementById("debugText")) { element = document.getElementById("debugText") // Append to list and limit to 20 lines logLines.push(fullMsg); if (logLines.length > 20) { logLines.shift(); } // Copy to HTML element.innerHTML = ""; for (line in logLines) { element.innerHTML += logLines[line] + "\n"; } } // Echo to console too console.log(fullMsg); } |
The HTML
You’ll notice that the Javascript code looks for a page element with the ID “debugText”. If it doesn’t find the element then the text won’t be visible – this actually makes it easy to enable/disable the logging by just editing the HTML. You’ll need to embed this ID in your page like so:
<pre id="debugText">DEBUG TEXT</ pre> |
(you’ll need to remove the space in the closing pre tag if you copy+paste that)
The code in action
Again.. really simple.. just call LOGMSG with your message:
LOGMSG("On no! An error!"); |
Wrapping up
This is only a very quick implementation of logging used to solve a simple problem, but if you’re in the same situation then it will work for you too. And if not, then you could use this as a starter block in your solution – I’d love to hear about it if you do. I’d also be interested to here about alternative solutions that you may have used.
Finally, here’s a picture of the logging in action, along with a sneak preview of the project I needed to debug:
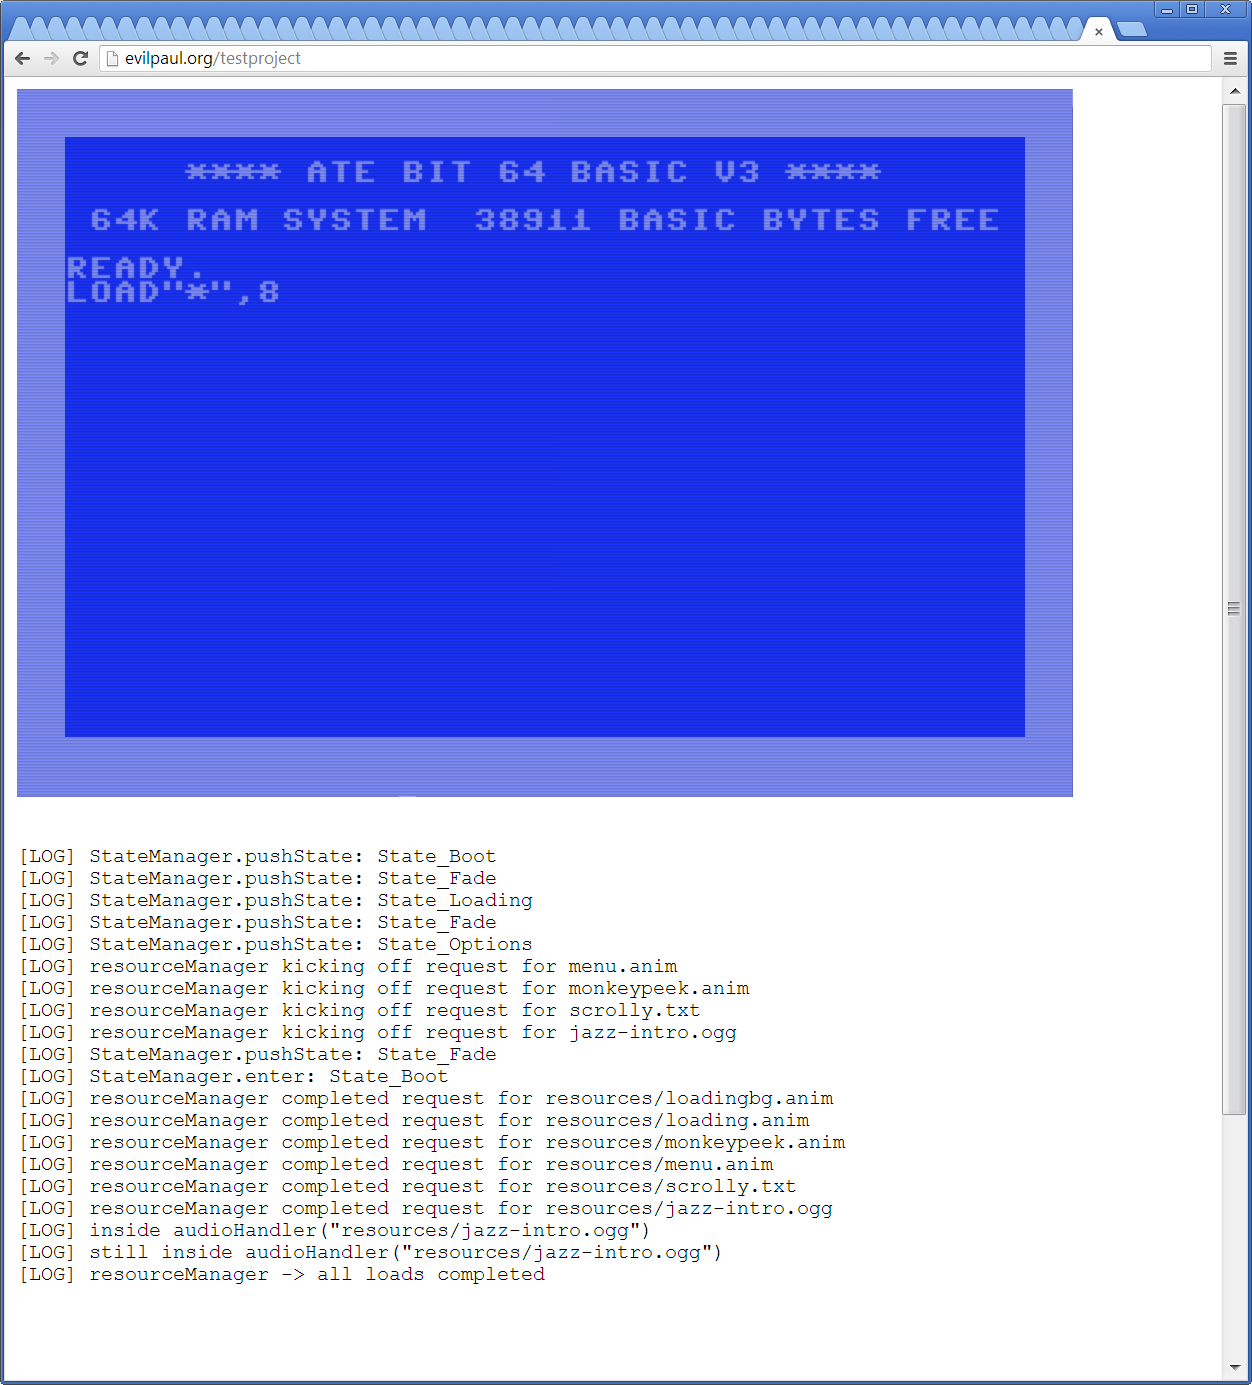
And btw… yes this did help me find the problem a lot more quickly than when I tried to get my test users to email me their console logs ;)


Glad that it worked.
:)
I have done a similar thing before, but had an “Something went wrong!” button at the end of the page instead of a log which posted the log data to an email script so the process of sending me the logs was simple.
Ended up getting many logs but never got around to fixing all of my horrible javascript.
Oh I like that idea Palmr. I guess you could take it even further by putting it in an exception handler and throwing up a “Would you like to email details about this bug to the developer?” alert box before sending the log.